Waterfall

Waterfall Charts are used to visually illustrate how a starting value of something becomes a final value through a series of intermediate additions and subtractions. It is most commonly used to show the evolution of revenues or profits between two periods of time.
Introduction
Waterfall chart are used for :
Composition
Recommandations for a perfect Waterfall chart :
Use the common codification for this chart (see section anatomy)
Don't hesitate to use dots to help understanding the values introduced sequentially and their linked effect.
Usage
When to use
If you want to see at a glance the progression from one year to the next.
If you want to view at profit and loss statements OR track inventory
If you want to compare product profits
When to avoid
When you have a doubt, use another chart. Waterfall are very specific and not easy for everyone. Indeed, it requiers to compare the lengths of objects that are floating in space. We are good at comparing the length of lines if those lines share a common baseline. So, here it’s hard to compare the specific sizes of growth or contraction between two subcategories.
Anatomy
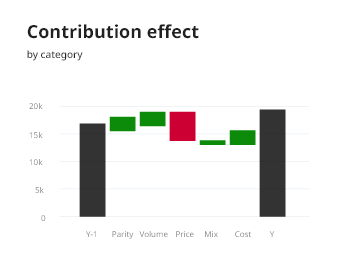
The objectif of this chart is to illustrates the cumulative effect of sequential or categorical positive and negative values applied to the starting value. The additions and subtractions can either be time-based (values in and out by month) or category-based (various sources of revenues and various sources of expenses for a given time period).
A waterfall is always represented with :
Totals and major Sub-Totals represented by full columns, while sub-components of the incoming and outgoing streams are represented by color-coded floating blocks.
The color-coded floating blocks have one color for negative value and one for positive value. We propose you to use blue or green for positive value and orange for negative value.
Starting value and Ending value are represented by one block in black.
You will have as many blocks as variable that impact the starting value.